
examples:artis_live
Table of Contents
ARTIS Live
Here, you can see some features of ARTIS Live at work on the oil & gas example project. The project has collected its own historical downtime data in an SQLite database. ARTIS Live
- uploads the historical downtime data, on the observation period from 1 Nov 2019 till 5 Dec 2020, from the database
- reports the achieved production availability on that period,
- makes new estimates of some MTTF and MTTR parameters, and
- makes a forecast for the remaining hours of 2020
To follow this example, you can visit oilProduction.html.
Upload past events
- Ctrl+U, data-upload, with the exact input shown below

- Click on the OK button, Only Once, this connects to the sqlite database on the ARTIS server with a query to upload the events table from the database into the model
- In the diagram, click on upstream - field2 - separation - train 1
 The groups and items that are down at the current time, in this example that is on 5 Dec 2020 at 00:00, have a grey background.
 - click on the V6001 icon, this shows the item form with the V6001 input

- click on the events button, this shows the event form and the event table of V6001, with 1 unplanned event

- click on the search button, this connects to the sqlite database on the ARTIS server with a query for the events of V6001

- leave the username and password fields empty and click on the Login button, this opens a new browser tab with a view on the database table that shows the V6001 event


When you have seen this, you can close the new browser tab and revert to the model.
Report the production availability on the observation period
- update the run form as shown below

- click on the OK button and then on the Submit button, wait for the results.zip download to arrive (a few seconds)
- save results.zip in your download folder and unzip it
- open results.html to see the impact of the seasonal capacity swings and the planned and unplanned events

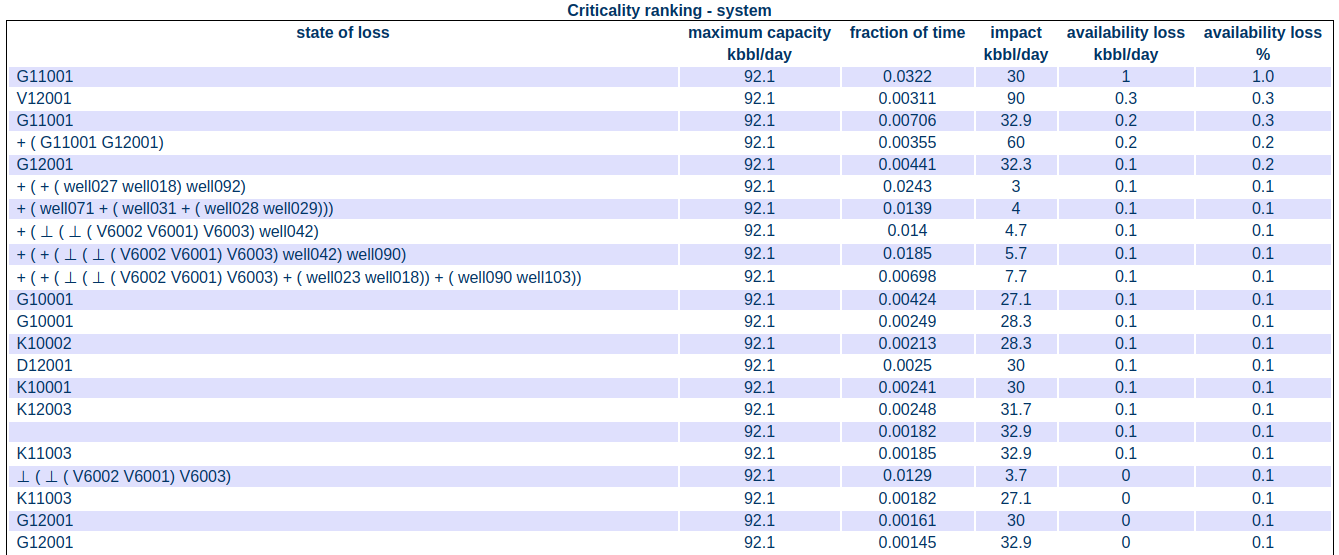


The criticality ranking shows
- The largest production availability loss is from the planned downtime of the G10001, G11001, G12001 gas turbines.
- The second largest impact arises from well downtime.
- Treater V12001 had an unplanned event of about 1 day.
Report the average lifetime and downtime on the observation period
- With the focus on the diagram, Ctrl+A, select all
- Ctrl+R, run form (don't change any input)

- click on the OK button and then on the Submit button, wait for the results download to arrive (a few seconds)
- save artis.csv in your download folder
- open artis.csv to review the average lifetime and downtime of the units, based on the uploaded events only
- Column H shows the mean lifetime.
- Column J shows the mean downtime.

Since the observation time is only a year, most units have seen only a few events. Only the wells have seen enough events to update their MTTF and MTTR.
This example is reproduced in the ARTIS Live example.
examples/artis_live.txt · Last modified: 2025/03/26 10:37 by pippi_langstrump